
These stats tell a shocking story
Fifty years since Martin Luther King Jr. called for an Economic Bill of Rights, how do stats today compare with 1968?
Is Dr. King’s Economic Bill of Rights needed even more now than in 1968?
Fifty years on, the USA is more unequal than in 1968 with greater levels of poverty, incarceration and war spending.
Fifty years on, the richest 85 people across the globe share a combined wealth of £1tn, as much as the poorest 3.5 billion of the world’s population.
Fifty years on, 69 out of the world’s top 100 economies are corporations.
Fifty years on, the facts speak for themselves – as a global family, we are worse off now than in 1968. This has not happened by accident, but through 4 decades of neoliberal policy implementation designed to benefit the few at the expense of the many. ‘Trickle down’ has not worked. ‘Trickle up’ has.
King’s awareness of the forces of global capital and the need for civil society to come together in the fight for different economic, social and political models is as relevant and urgent as it was in 1968.
King speaking in 1967 said
‘It is estimated that the USA spends $322,000 for every person we kill in Vietnam, while we spend $53 per person classed as poor, in the ‘War on Poverty’ (LBJ’s campaign).
Fifty years on from King’s call for an Economic Bill of Rights, we need to finish what he started.
Then and Now
1. Inequality in the USA
TAXATION USA
1968 Top Federal Tax Rates
Top Rate on Regular Income: 75.25%
Top Rate on Capital Gains: 26.9%
Top Rate on Corporate Tax: 52.8%
2015 Top Federal Tax Rates
Top Rate on Regular Income: 39.6%
Top Rate on Capital Gains: 25%
Top Rate on Corporate Tax: 35%
HOME OWNERSHIP USA
1968 63.9% 2014 65%
Black homeowners are not better off today than they were four decades ago. In terms of homeownership exits, they are worse off now. http://www.citylab.com/housing/2014/07/black-homeowners-are-worse-off-today-than-they-were-40-years-ago/374824/
2015 73% percent of whites own a home, compared to 47% of Latinos and 45% of blacks.
POVERTY USA
1968 13% 2011 15%
1968 25m 2011 46m
CHILD POVERTY USA
1969 13.8% 2012 21.3%
INCARCERATION USA
1968 94 per 100k population 2014 471 per 100k
SHARE OF TOTAL US INCOME BY 1%
1968 9% 2013 21%
SHARE OF TOTAL US INCOME BY 0.1%
1968 1% 2013 5%
MILITARY SPENDING USA
1968 $600 billion 2015 $1300 billion
More info
http://owsposters.tumblr.com/post/11944143747/if-us-land-mass-were-distributed-like-us
https://inequality.stanford.edu/publications/20-facts-about-us-inequality-everyone-should-know
https://inequality.org/facts/income-inequality/
http://www.irp.wisc.edu/faqs/faq2.htm
http://www.cnsnews.com/news/article/ali-meyer/1-5-children-live-poverty-us
http://www.sentencingproject.org/criminal-justice-facts/
http://www.sentencingproject.org/issues/incarceration/
https://www.prisonpolicy.org/reports/incomejails.html
https://www.thenation.com/article/how-obsolete-triumphalist-militarism-is-destroying-america/
https://www.huffingtonpost.com/entry/a-year-of-us-militarism_us_58667a23e4b04d7df167d42c
2. Inequality in the global south
Economic Inequality
Brazil
https://www.oxfam.org/en/even-it-brazil/brazil-extreme-inequality-numbers
South Africa
http://www.statssa.gov.za/?p=10334
https://www.economist.com/news/middle-east-and-africa/21722155-democracy-has-brought-wealth-only-few
3. The World Inequality Report 2018
Read the World Inequality Report.
In recent decades, income inequality has increased in nearly all countries, but at different speeds, suggesting that institutions and policies matter in shaping inequality.
- Since 1980, income inequality has increased rapidly in North America, China, India, and Russia. Inequality has grown moderately in Europe. From a broad historical perspective, this increase in inequality marks the end of a postwar egalitarian regime which took different forms in these regions.

Global income growth and inequality, 1980–2016

Share of global growth captured by income groups, 1980–2016

- There are exceptions to the general pattern. In the Middle East, sub-Saharan Africa, and Brazil, income inequality has remained relatively stable, at extremely high levels. Having never gone through the postwar egalitarian regime, these regions set the world “inequality frontier.”

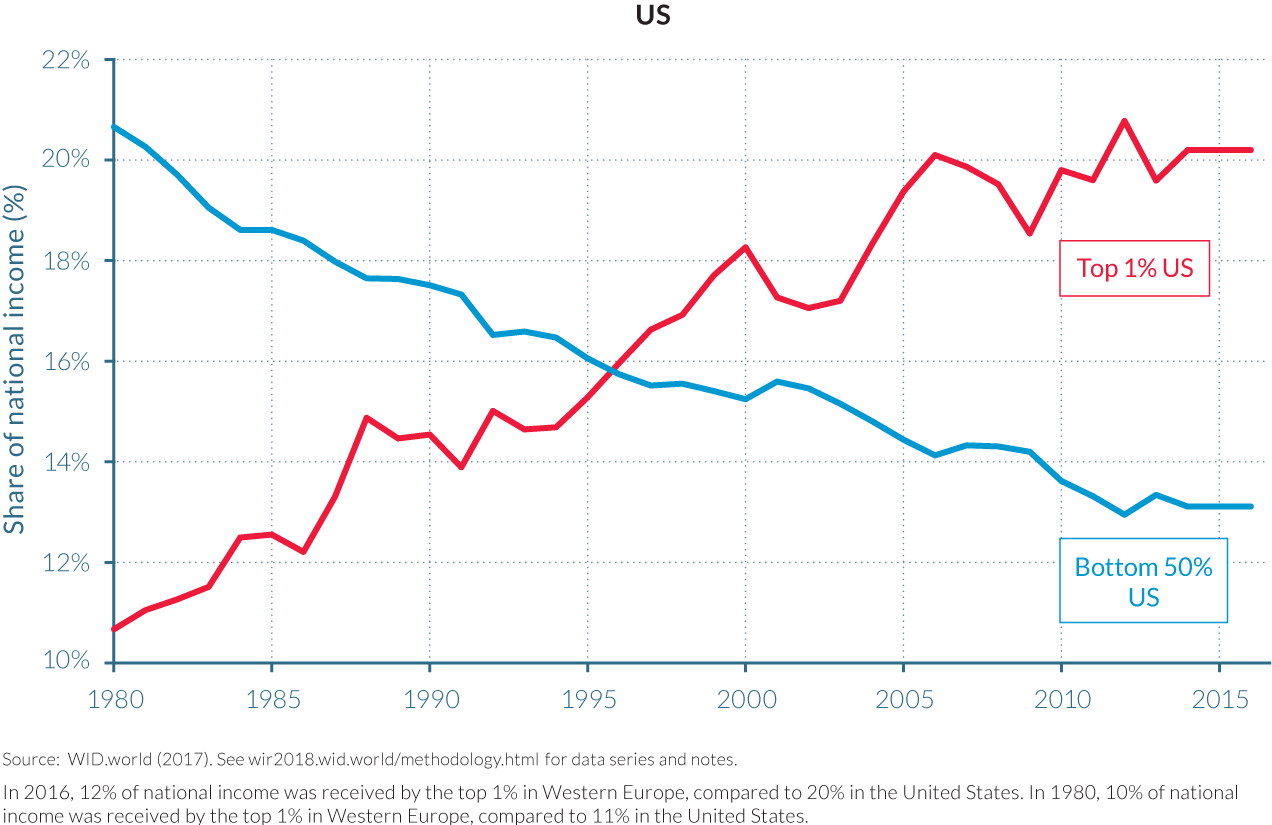
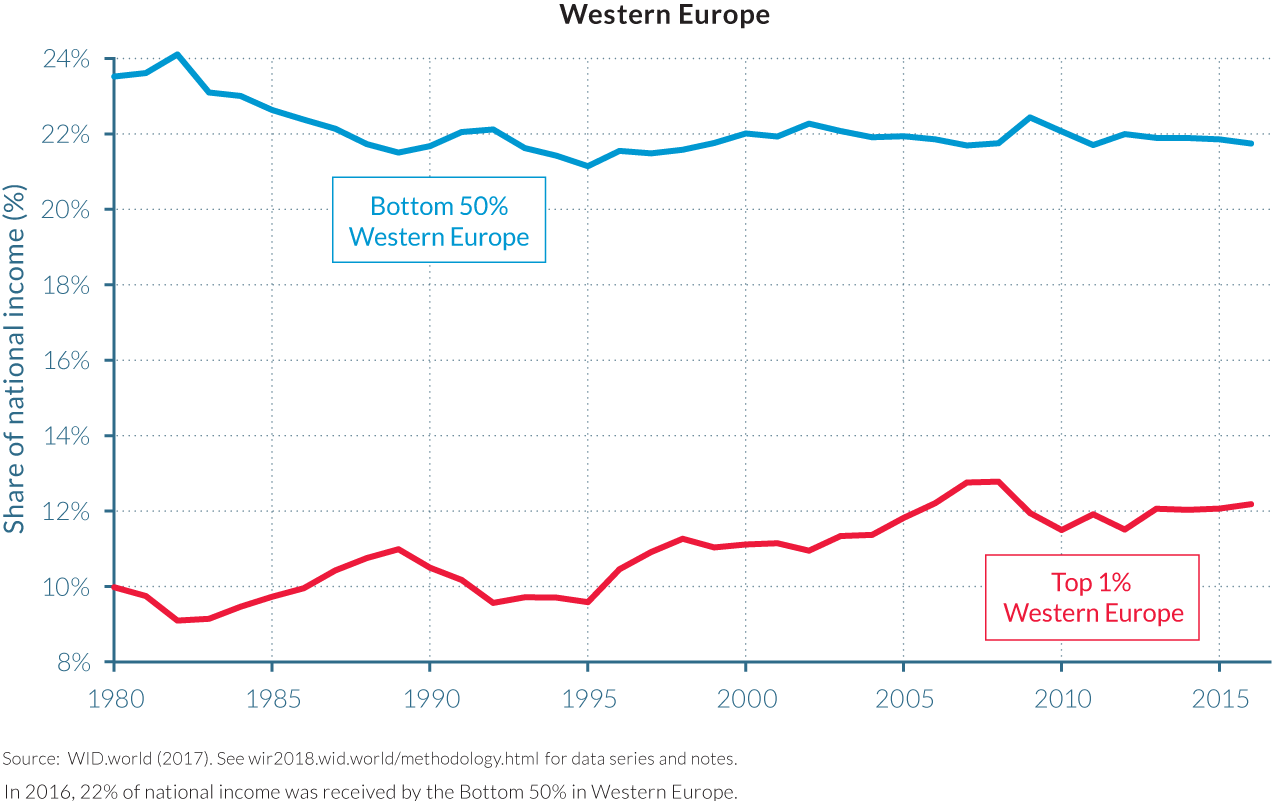
- The divergence in inequality levels has been particularly extreme between Western Europe and the United States, which had similar levels of inequality in 1980 but today are in radically different situations. While the top 1% income share was close to 10% in both regions in 1980, it rose only slightly to 12% in 2016 in Western Europe while it shot up to 20% in the United States. Meanwhile, in the United States, the bottom 50% income share decreased from more than 20% in 1980 to 13% in 2016.
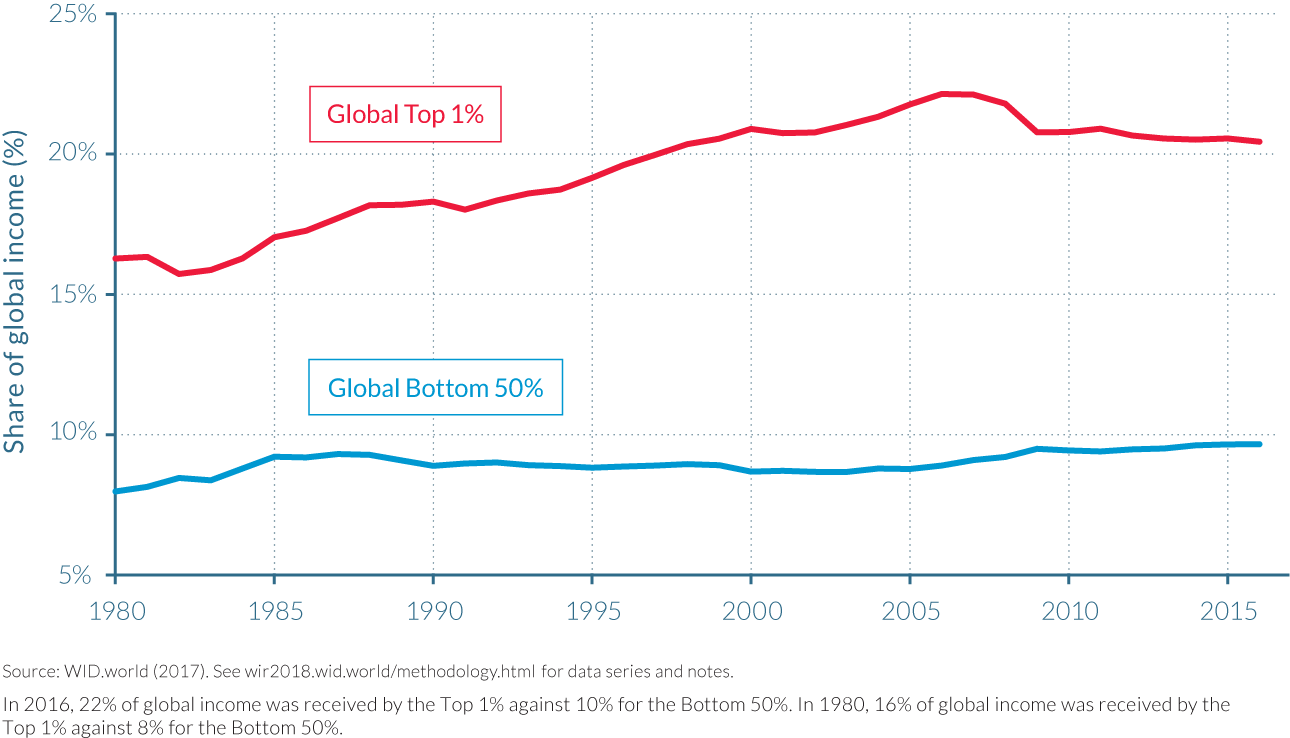
At the global level, inequality has risen sharply since 1980, despite strong growth in China.
- The poorest half of the global population has seen its income grow significantly thanks to high growth in Asia (particularly in China and India). However, because of high and rising inequality within countries, the top 1% richest individuals in the world captured twice as much growth as the bottom 50% individuals since 1980. Income growth has been sluggish or even zero for individuals with incomes between the global bottom 50% and top 1% groups. This includes all North American and European lower- and middle-income groups.

- The rise of global inequality has not been steady. While the global top 1% income share increased from 16% in 1980 to 22% in 2000, it declined slightly thereafter to 20%. The income share of the global bottom 50% has oscillated around 9% since 1980 (Figure E5). The trend break after 2000 is due to a reduction in between-country average income inequality, as within-country inequality has continued to increase.
Over the past decades, countries have become richer but governments have become poor.
The rise of private capital and the fall of public capital in rich countries, 1970–2016

The decline of public capital, 1970–2016
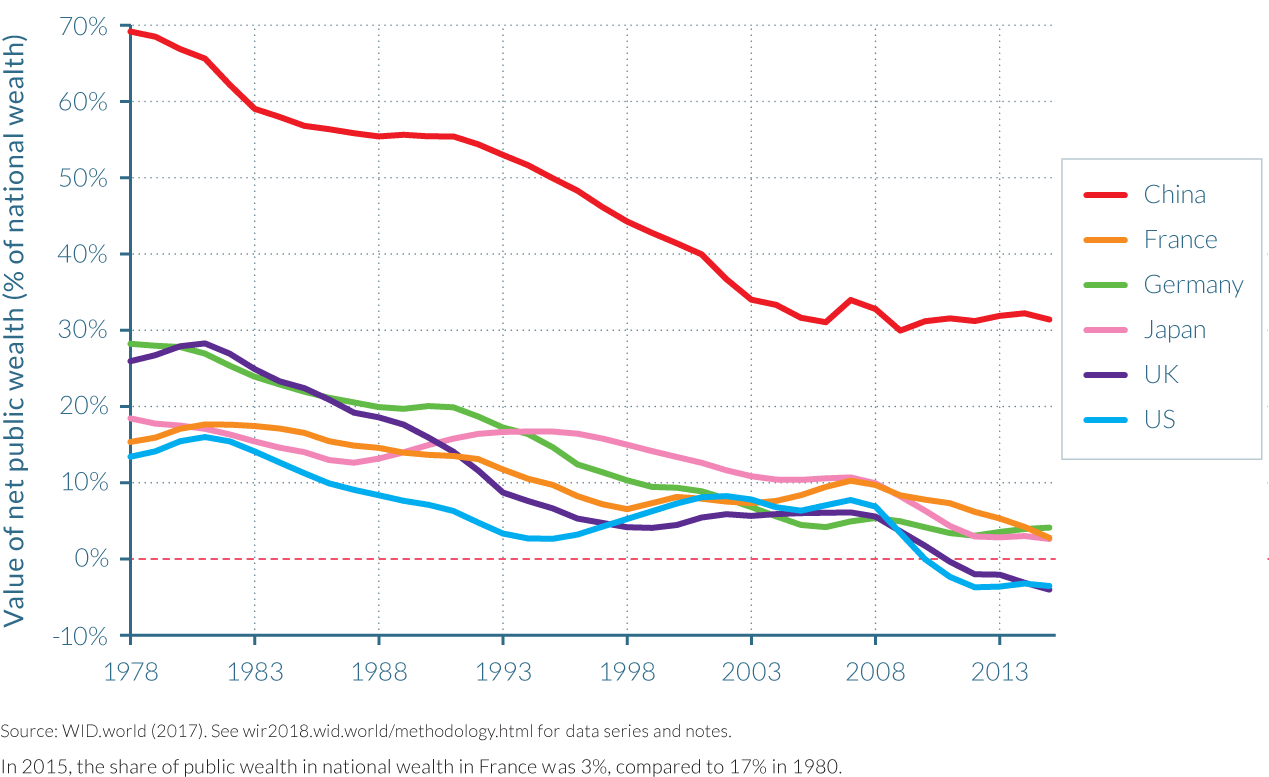
The combination of large privatizations and increasing income inequality within countries has fueled the rise of wealth inequality among individuals. In Russia and the United States, the rise in wealth inequality has been extreme, whereas in Europe it has been more moderate. Wealth inequality has not yet returned to its extremely high early-twentieth-century level in rich countries.
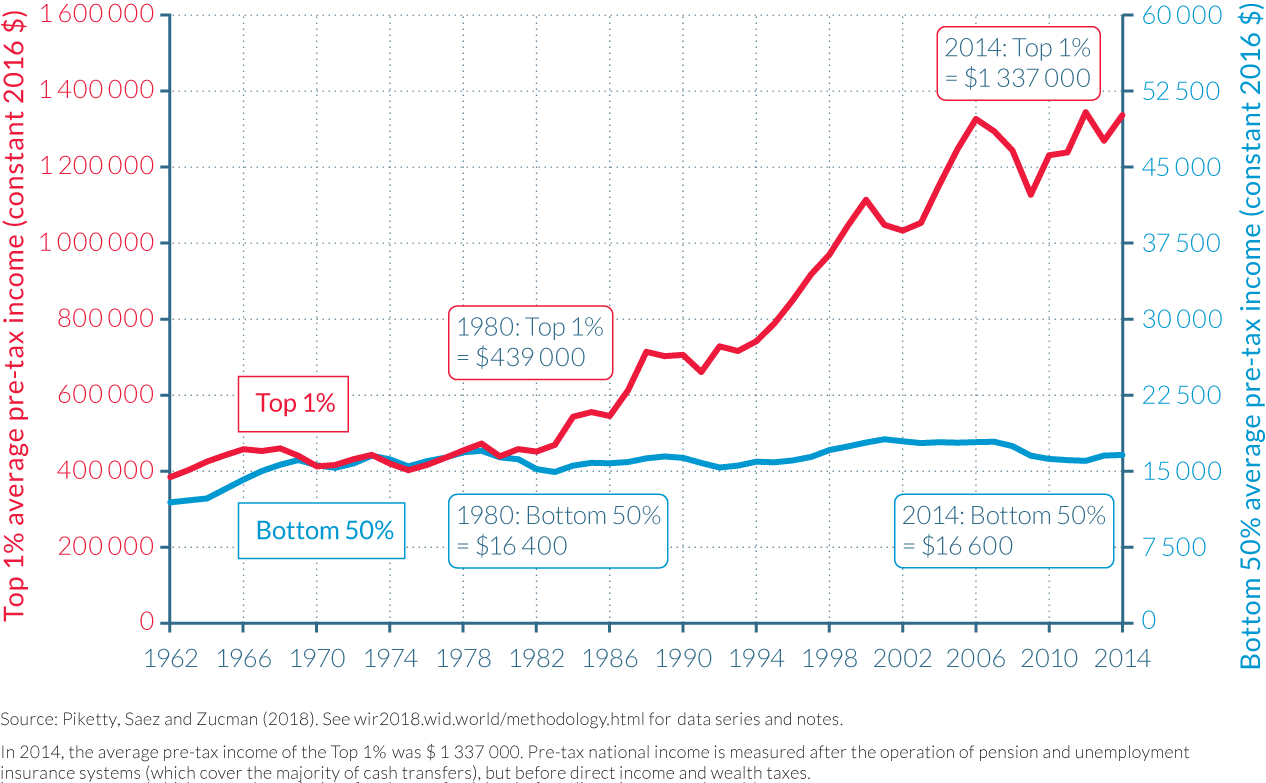
- The rise in wealth inequality has nonetheless been very large in the United States, where the top 1% wealth share rose from 22% in 1980 to 39% in 2014. Most of that increase in inequality was due to the rise of the top 0.1% wealth owners. The increase in top-wealth shares in France and the UK was more moderate over the past forty years, in part due to the dampening effect of the rising housing wealth of the middle class, and a lower level of income inequality than the United States’.

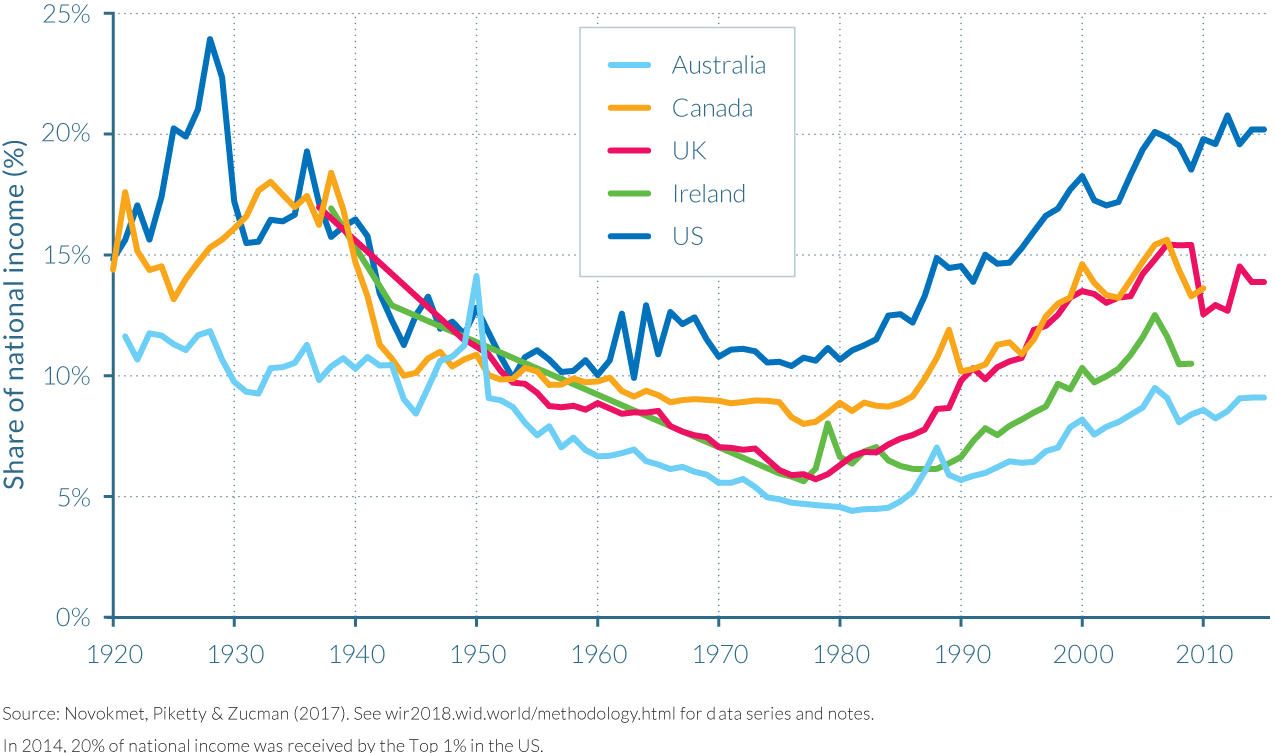
Top 1% national income share in Anglophone countries, 1920–2015
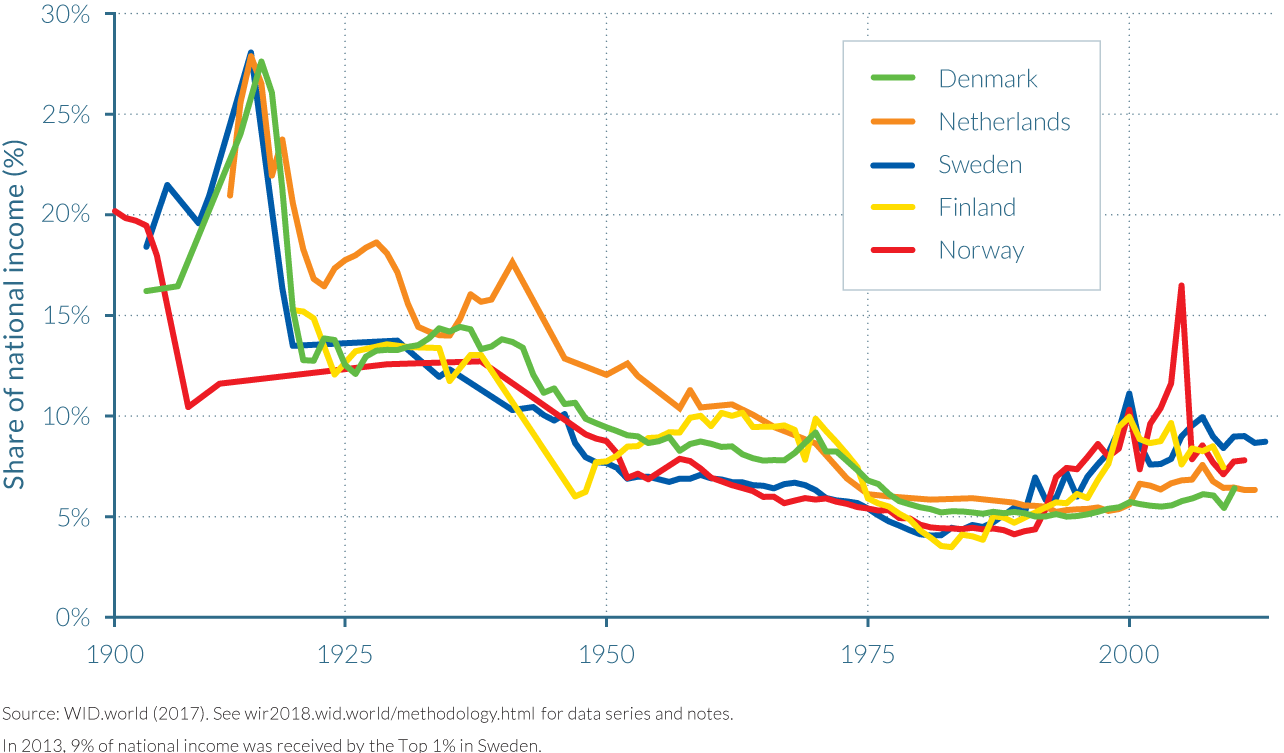
Top 1% national income share in Northern European countries, 1900–2013
In Russia, China, and India, income inequality surged after the 1980s
Top 1% national income share in emerging countries 1900–2015

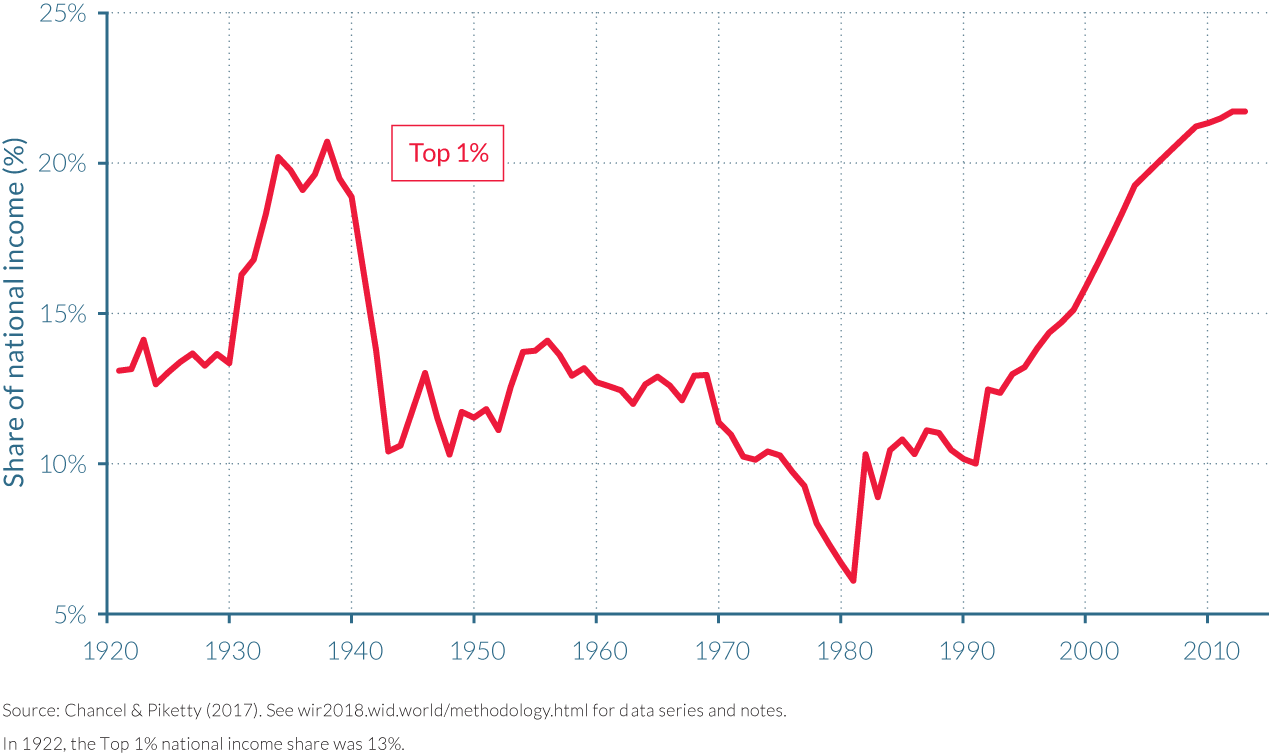
- Inequality in India has risen back to levels not seen since the days of the British Raj
Top 1% income share in India, 1922–2014
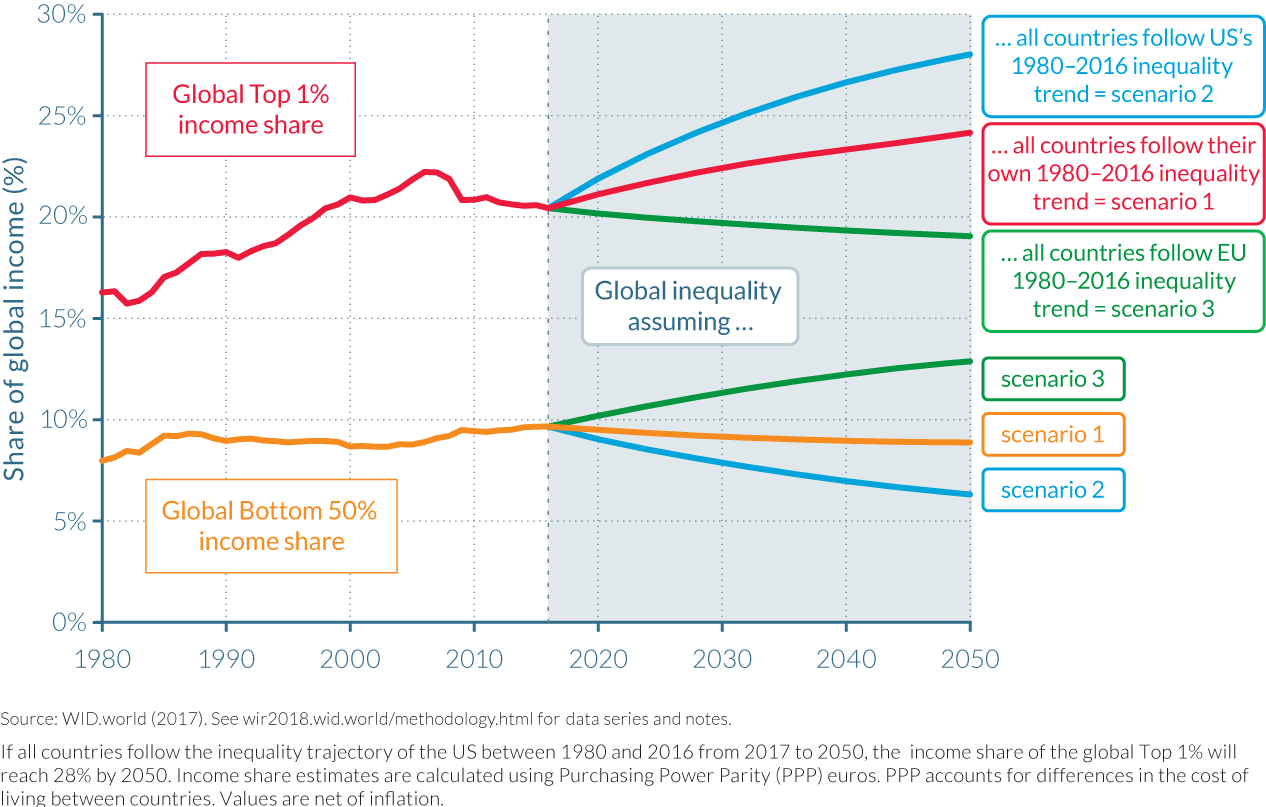
In a future in which “business as usual” continues, global inequality will further increase. Alternatively, if in the coming decades all countries follow the moderate inequality trajectory of Europe over the past decades, global income inequality can be reduced—in which case there can also be substantial progress in eradicating global poverty.
- Global income inequality will increase if countries prolong the income inequality path they have been on since 1980—even with relatively high income growth predictions in Africa, Latin America, and Asia in the coming three decades. Global income inequality will increase even more if all countries follow the high-inequality trajectory followed by the United States between 1980 and 2016. However, global inequality will decrease moderately if all countries follow the inequality trajectory followed by the EU between 1980 and today
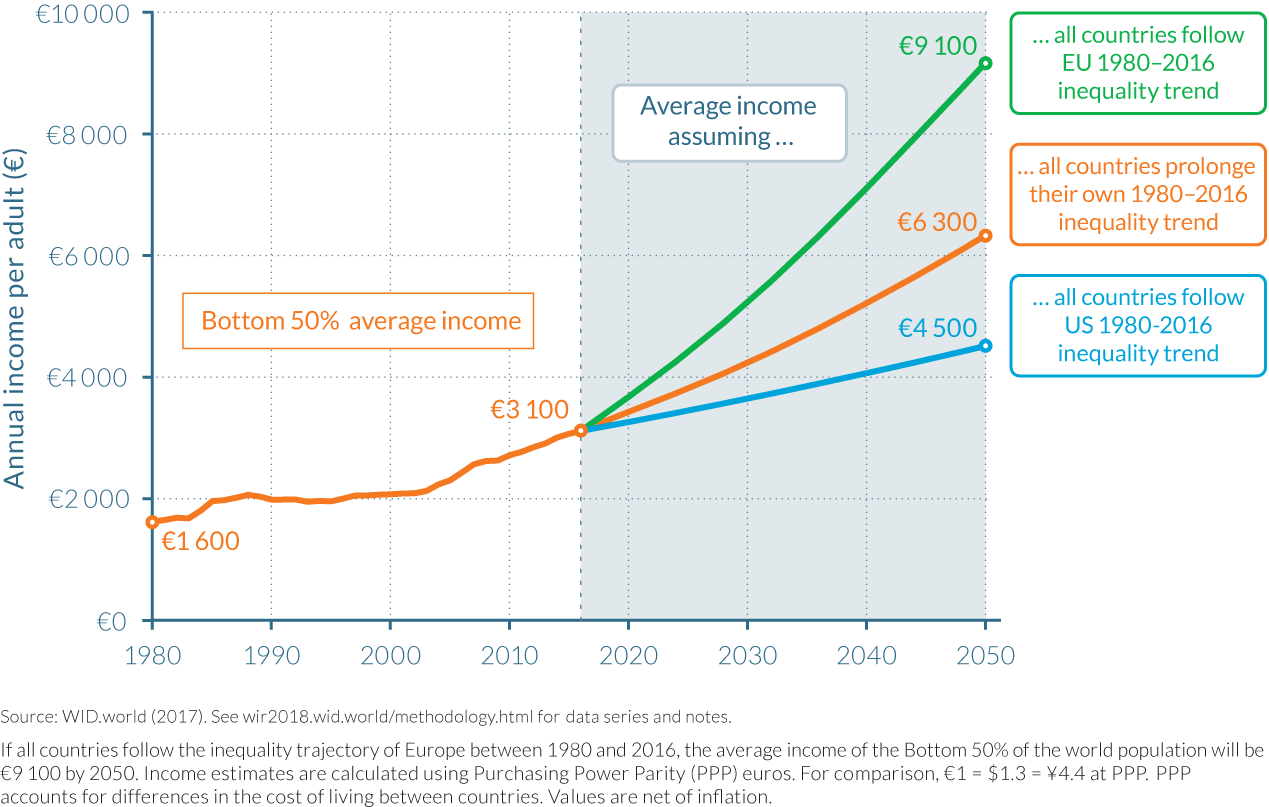
- Within-country inequality dynamics have a tremendous impact on the eradication of global poverty. Depending on which inequality trajectory is followed by countries, the incomes of the bottom half of the world population may vary by factor of two by 2050 (Figure E11), ranging from €4 500 to € 9100 per year, per adult.
4. More on the subject
- Jamaica : A great film that still holds today
http://www.lifeanddebt.org - Robert Reich: Inequality for All
http://inequalityforall.com/ - Ha Joon Chang
http://hajoonchang.net/ - Thomas Picketty
http://piketty.pse.ens.fr/en/ - Branko Milanovic
http://glineq.blogspot.nl/ - Paul Mason
https://medium.com/mosquito-ridge

3 thoughts on “1968 and today: Stats to Shock”
Comments are closed.